Establishing an Air Quality Monitoring Network to Inform Local Strategies
Project Background
MORPC and Franklin County Public Health have partnered to establish the Community Led Enhanced Air Quality Network (CLEAN), a network of air quality sensors that measures air pollution, neighborhood-by-neighborhood, in Franklin County. By gathering more data at the local level, this project will help guide the strategies that go into making the region’s air healthier and easier to breathe.
Check out our collaborative dashboard showing pollution trends in Franklin County. By clicking the map below, or by searching for your address, you can find out what sources of pollution are in your neighborhood.
Where is particle pollution coming from?
Our team is working with Ramboll Americas Engineering Solutions, Inc. to put all of our air sensor data into the Shair Model for Franklin County, OH. This model shows the major sources of particulate matter pollution – categorized by background, area, traffic, point, and uncategorized – per neighborhood. Gaining a better understanding of pollution sources can help us focus on the most impactful solutions.
What do each of these pollution categories mean?
Background – The naturally occurring and/or low-level pollution that is present in the atmosphere.
Area – Numerous, smaller sources that, when taken together, contribute significantly to overall air pollution, such as gas stations, dry cleaners, and wood stoves.
Traffic – Air pollution caused by motor vehicle emissions resulting from fossil fuel combustion.
Point – Single, identifiable location or fixed facility that releases air pollutants that can be human-made or natural, such as smokestacks on factories.
Uncategorized – these sources tend to be unregulated, hard to track, or not fully understood, and can include open burning, unauthorized activity, emerging technologies, or natural sources (decaying organic materials).
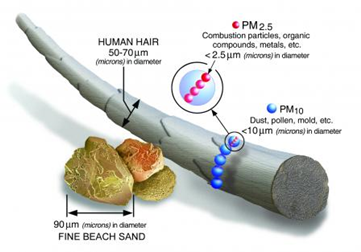
What is particle pollution?
Particle air pollution – or particulate matter 2.5 (PM2.5) – consists of tiny pieces of matter, such as smoke, soot, and dust, that are 45 times smaller than a grain of sand. In fact, PM2.5 is so small that when you breathe it in, it can pass through your lungs and into your bloodstream, causing inflammation in your body. It has been linked to heart and lung diseases because of the inflammation it causes. Exposure to particle pollution has also been linked to worse COVID-19 outcomes for people who contracted COVID-19.
Where are we monitoring particulate matter?
Air pollution affects everyone, but some communities face greater risks. Children under 5, adults 65+, people with asthma or other respiratory illnesses, and those in low-income or minority communities are especially vulnerable. Guided by community input and data on health and demographics, we prioritized air quality sensor placement across Franklin County—focusing on ZIP codes with the highest potential impact from air pollution.
Explore real-time air quality in your neighborhood
Take a real-time look at our network of sensors so far! Our team uses PurpleAir sensors to monitor particle pollution, or PM2.5. Click on a sensor reading (circle), for more details about the air quality in that area and a graph of past air quality conditions. Note that this map includes all active sensors and those that are part of our project are labeled with “MORPC” when you click on a location.